Monitoring with Grafana
A monitoring service, using Grafana, can be found here: https://t1metria.cr.cnaf.infn.it/d/MAXpbtVMk/home?orgId=18.
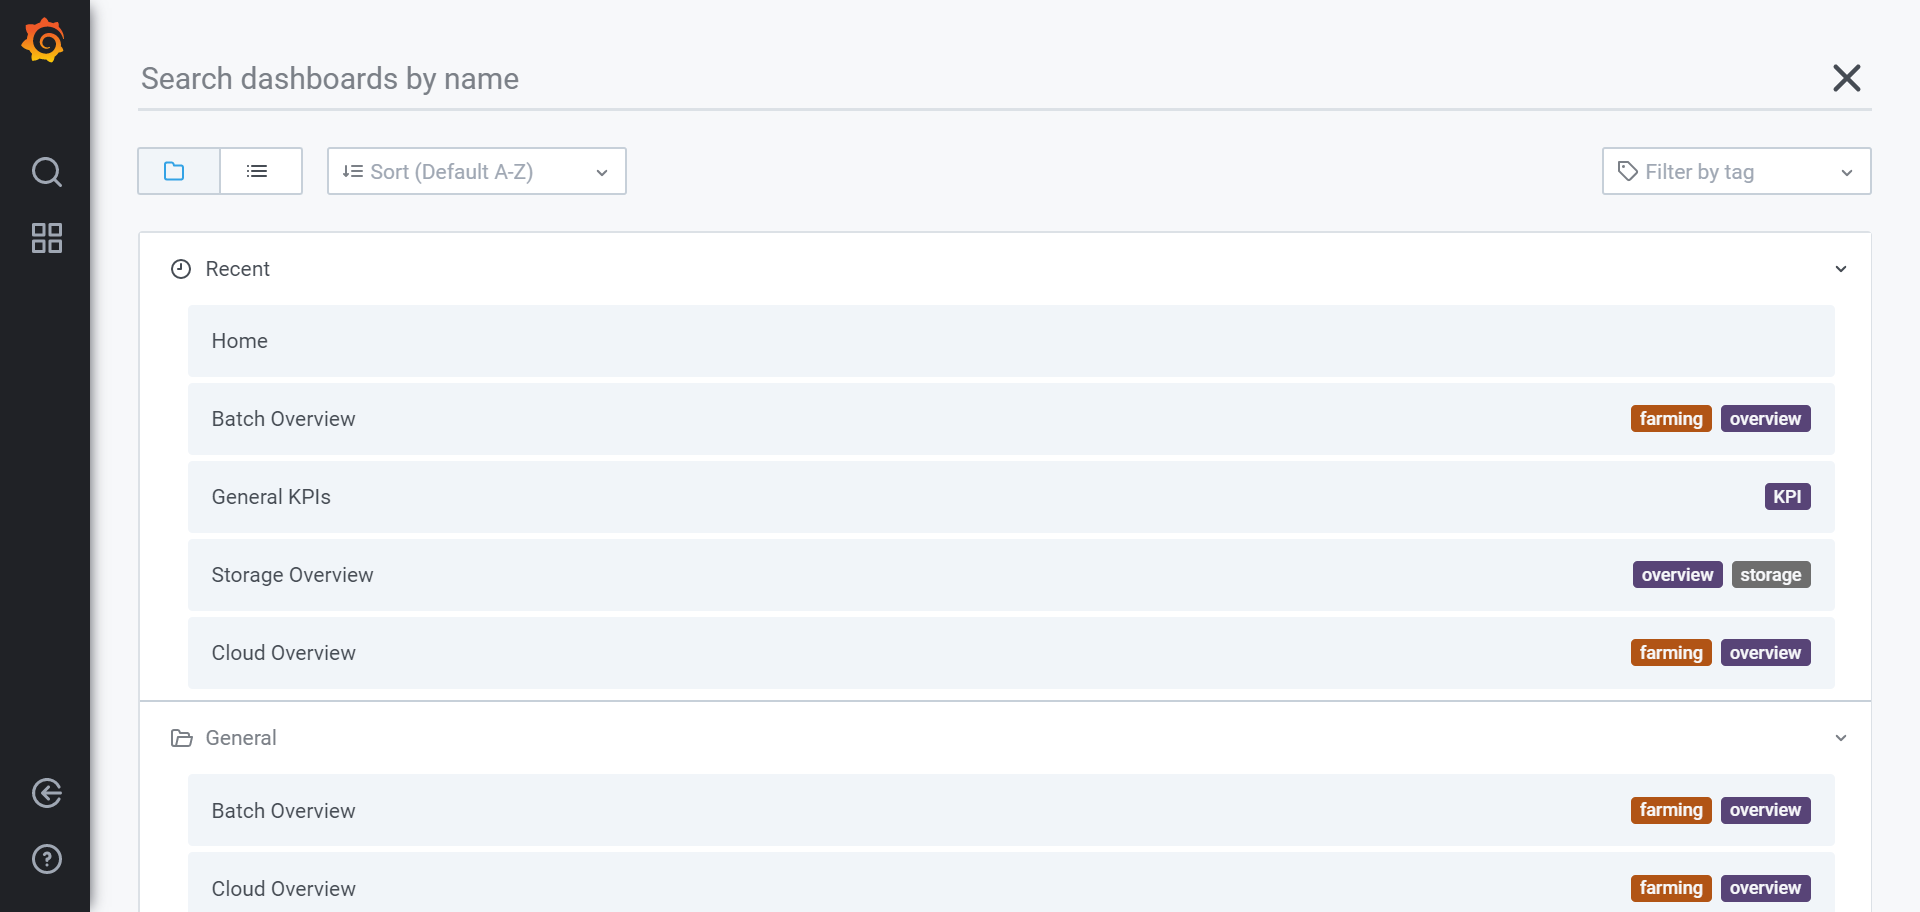
On this page it's possible to select which type of resource to monitor and then look for the desired experiment.
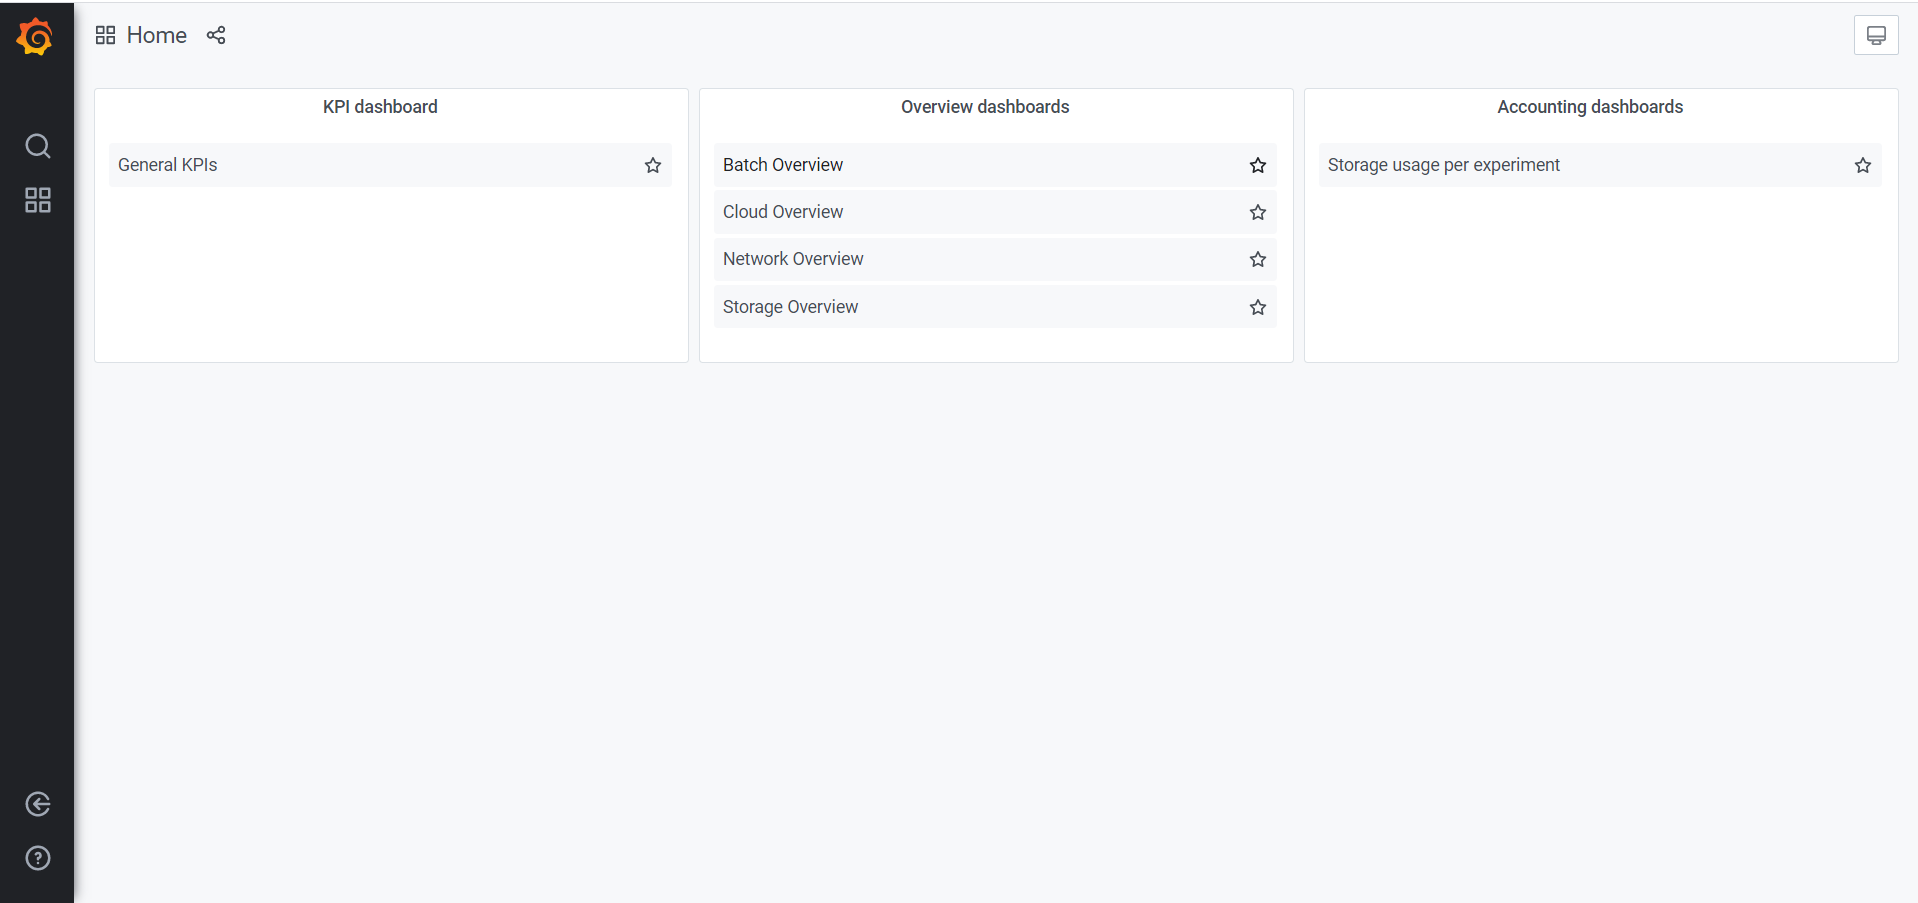
The same actions are feasible from the "Home" button, which opens the following menu.
NB: If some script fails to get data it results in a zero record, which doesn't mean that the resource is unavailable.
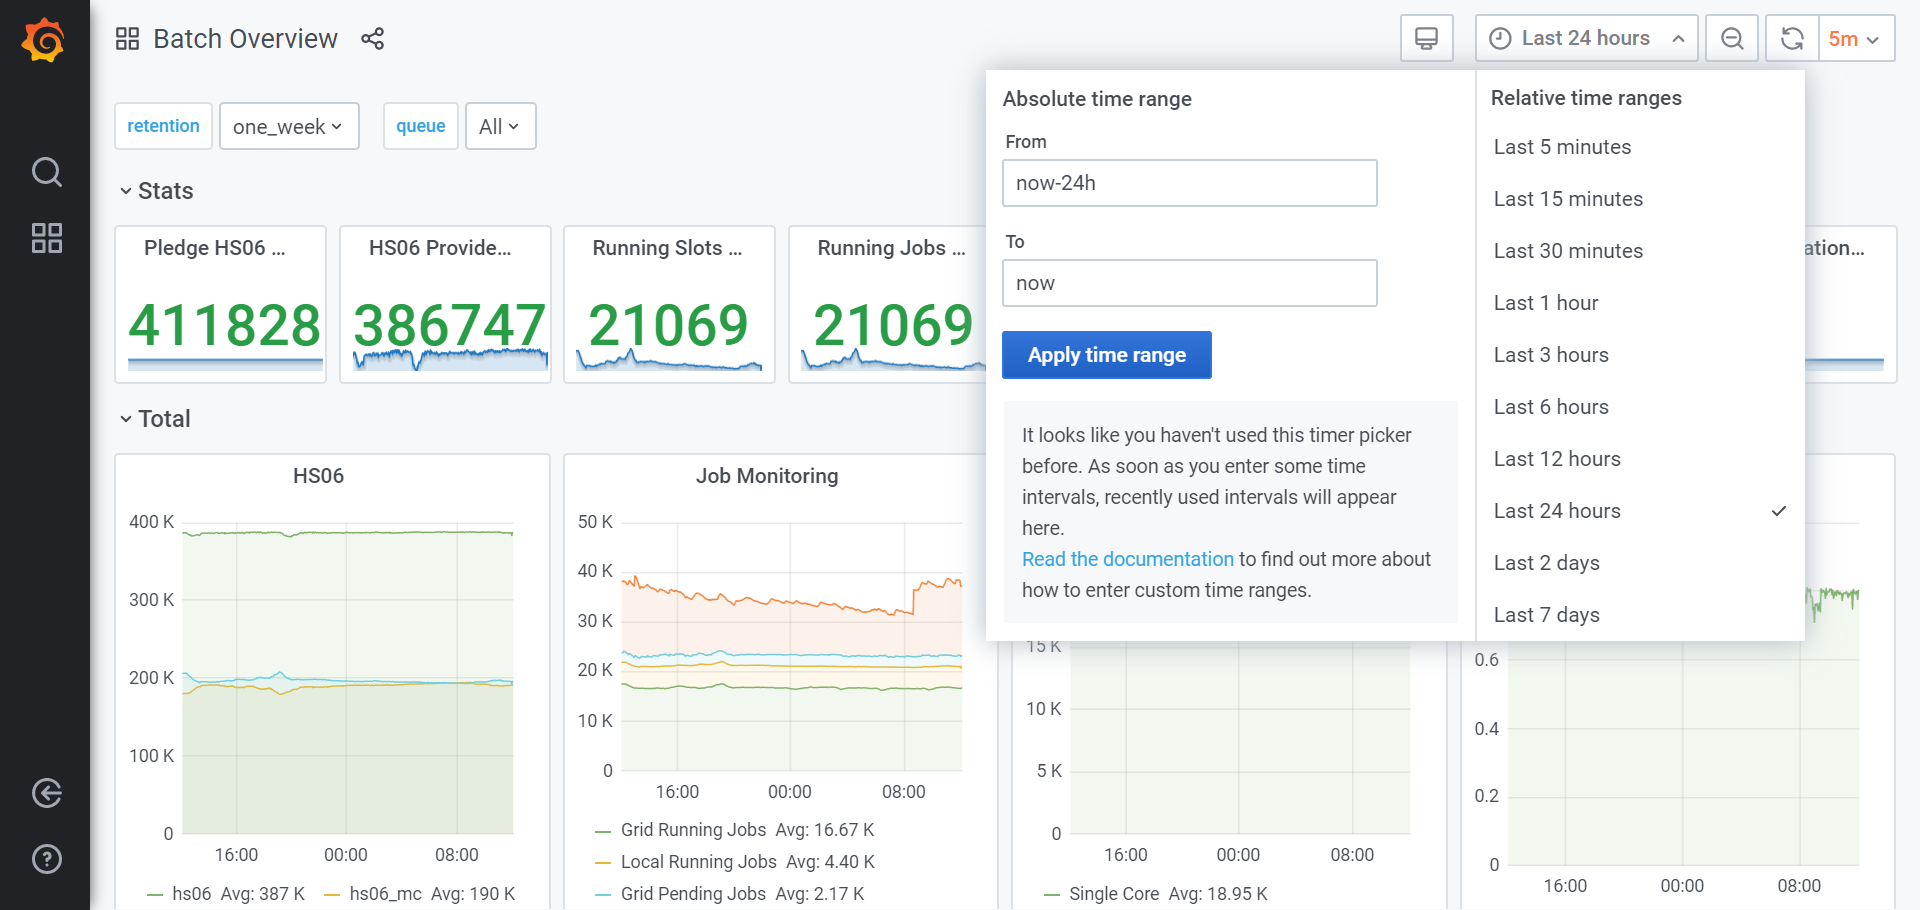
In the top right corner you can change the time interval to watch:
and, selecting one of the "per queue" views, you can choose which ones to show.
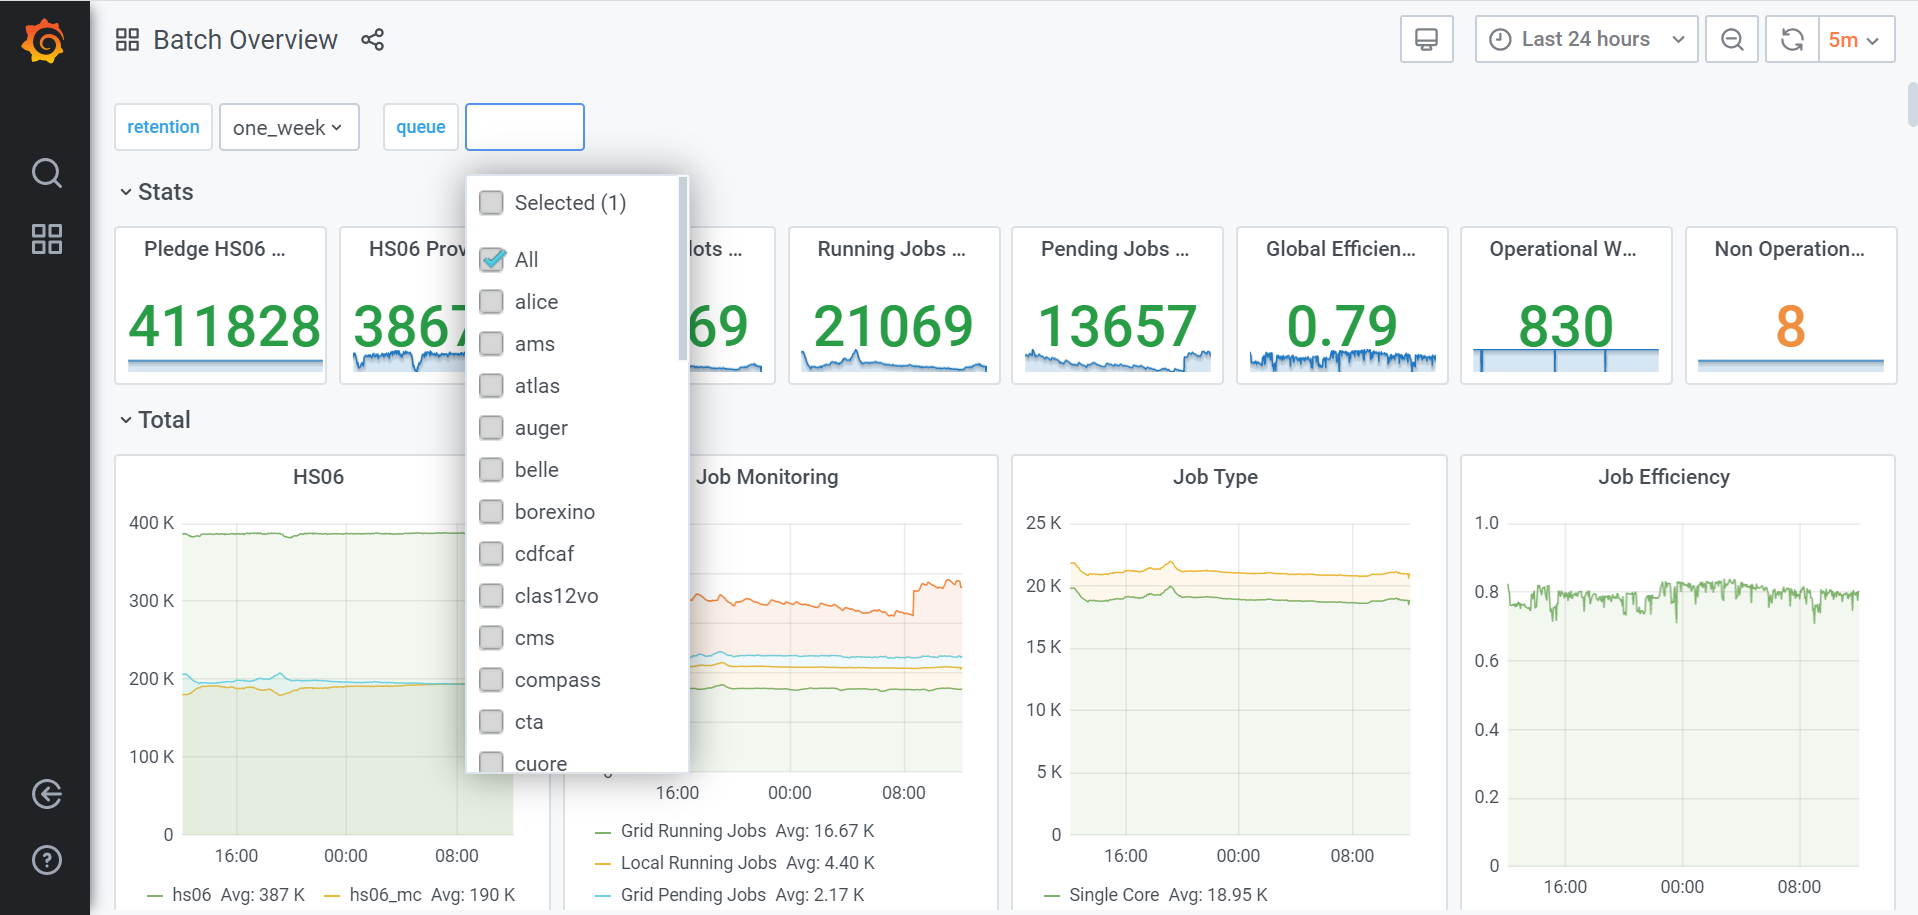
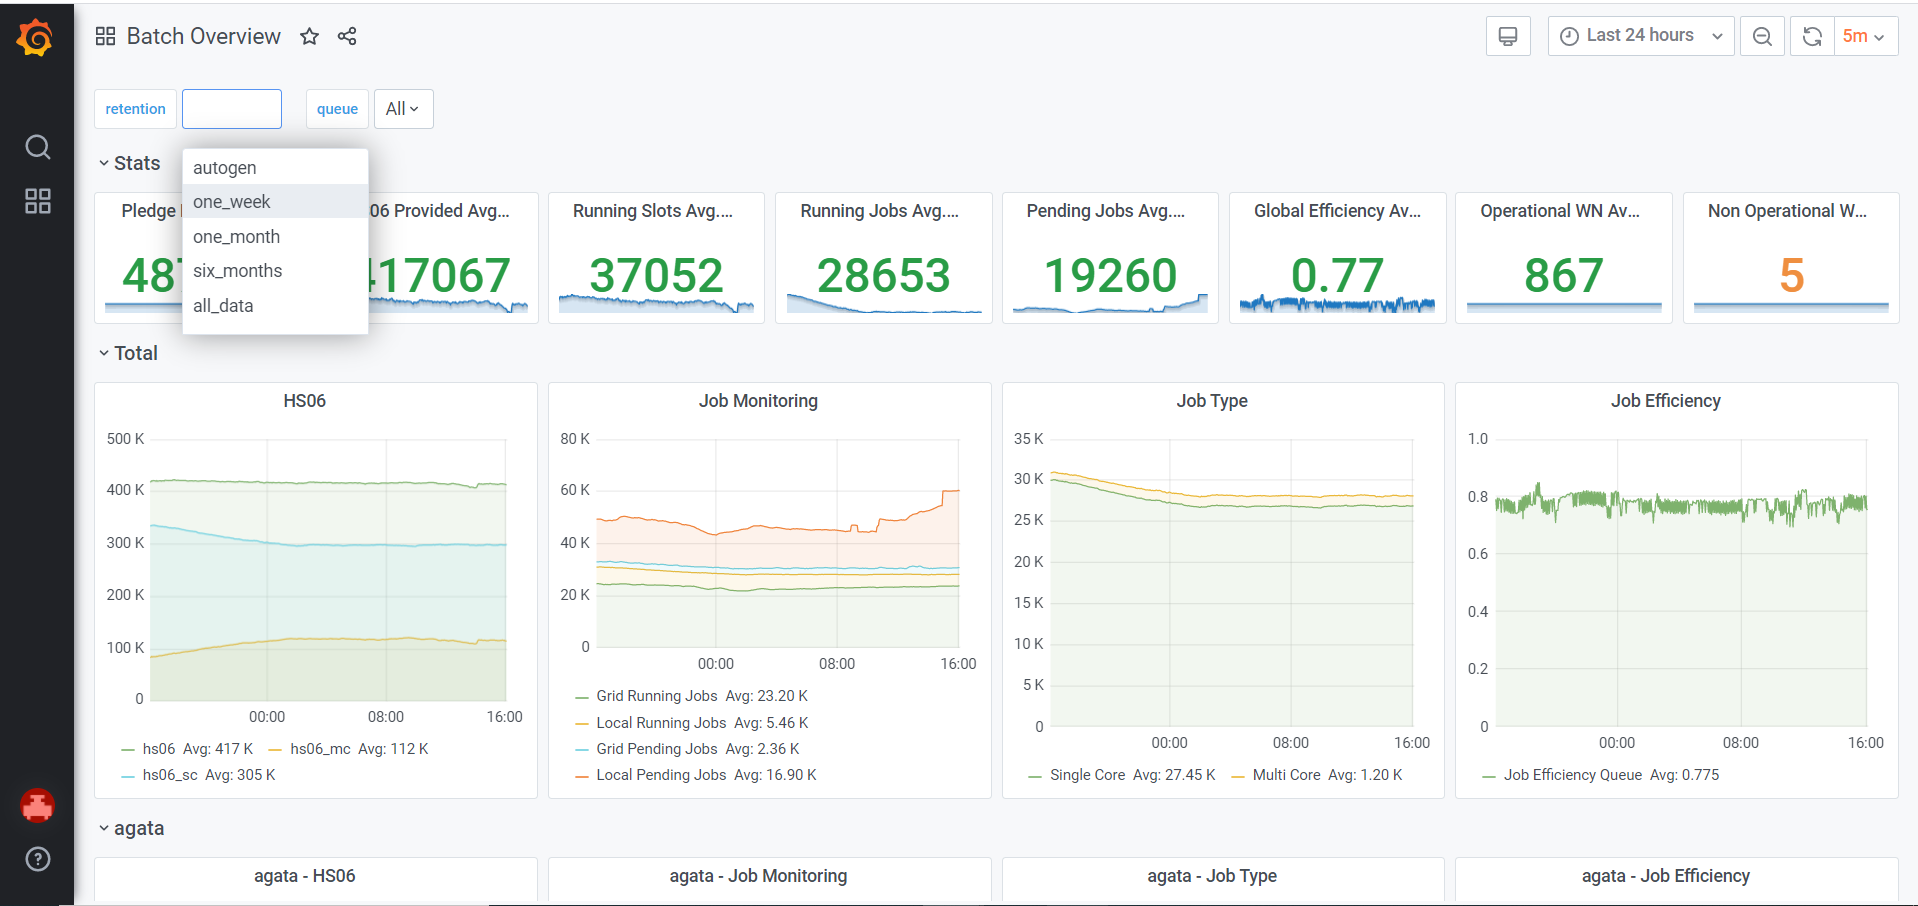
You can also select the desired retention, by clicking on the top left corner:
Moreover, disk situation can be checked here: http://www.cnaf.infn.it/~vladimir/gpfs.