-
Created by
 Daniele Lattanzio, last updated on Jul 07, 2021
2 minute read
Daniele Lattanzio, last updated on Jul 07, 2021
2 minute read
Monitoring with Grafana
Experiments at INFN-Tier 1 use Grafana as a monitoring service. Grafana is a useful dashboard application with a web interface, providing many types of graphs for different services, such as Storage, Farming, and Facility overview.
Grafana can be found here: https://t1metria.cr.cnaf.infn.it/d/MAXpbtVMk/home?orgId=18.
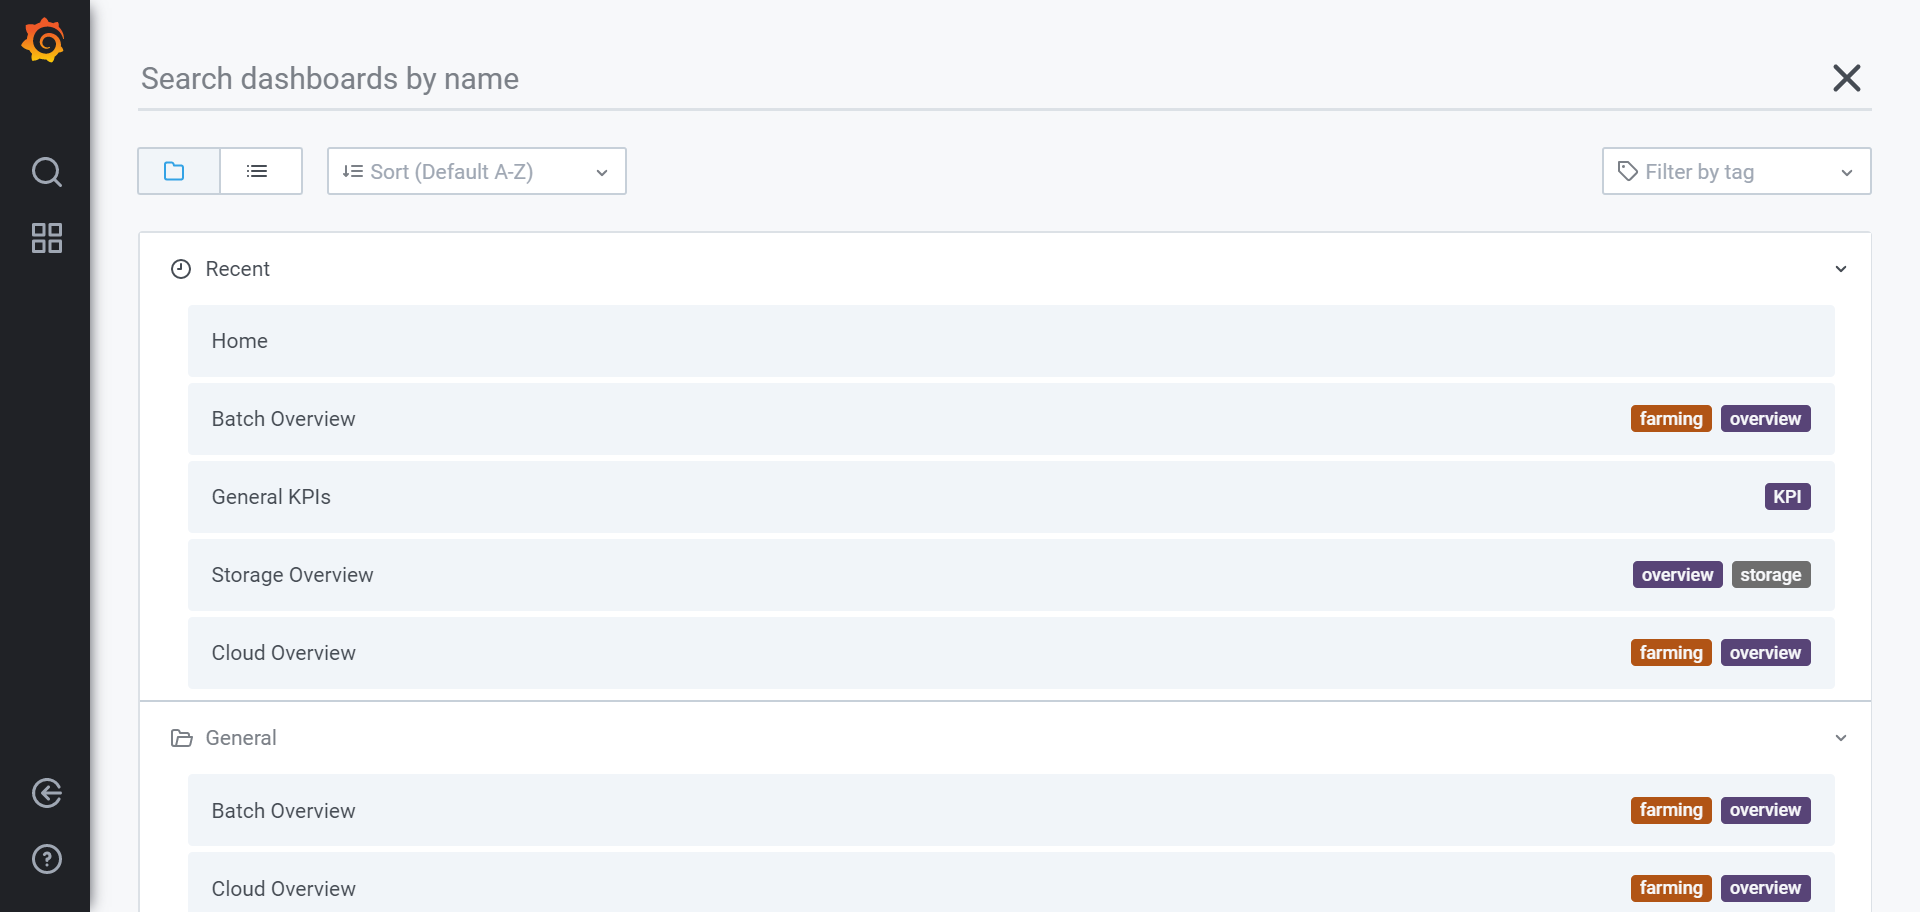
On this page it's possible to select which type of resource to monitor and then look for the desired experiment.
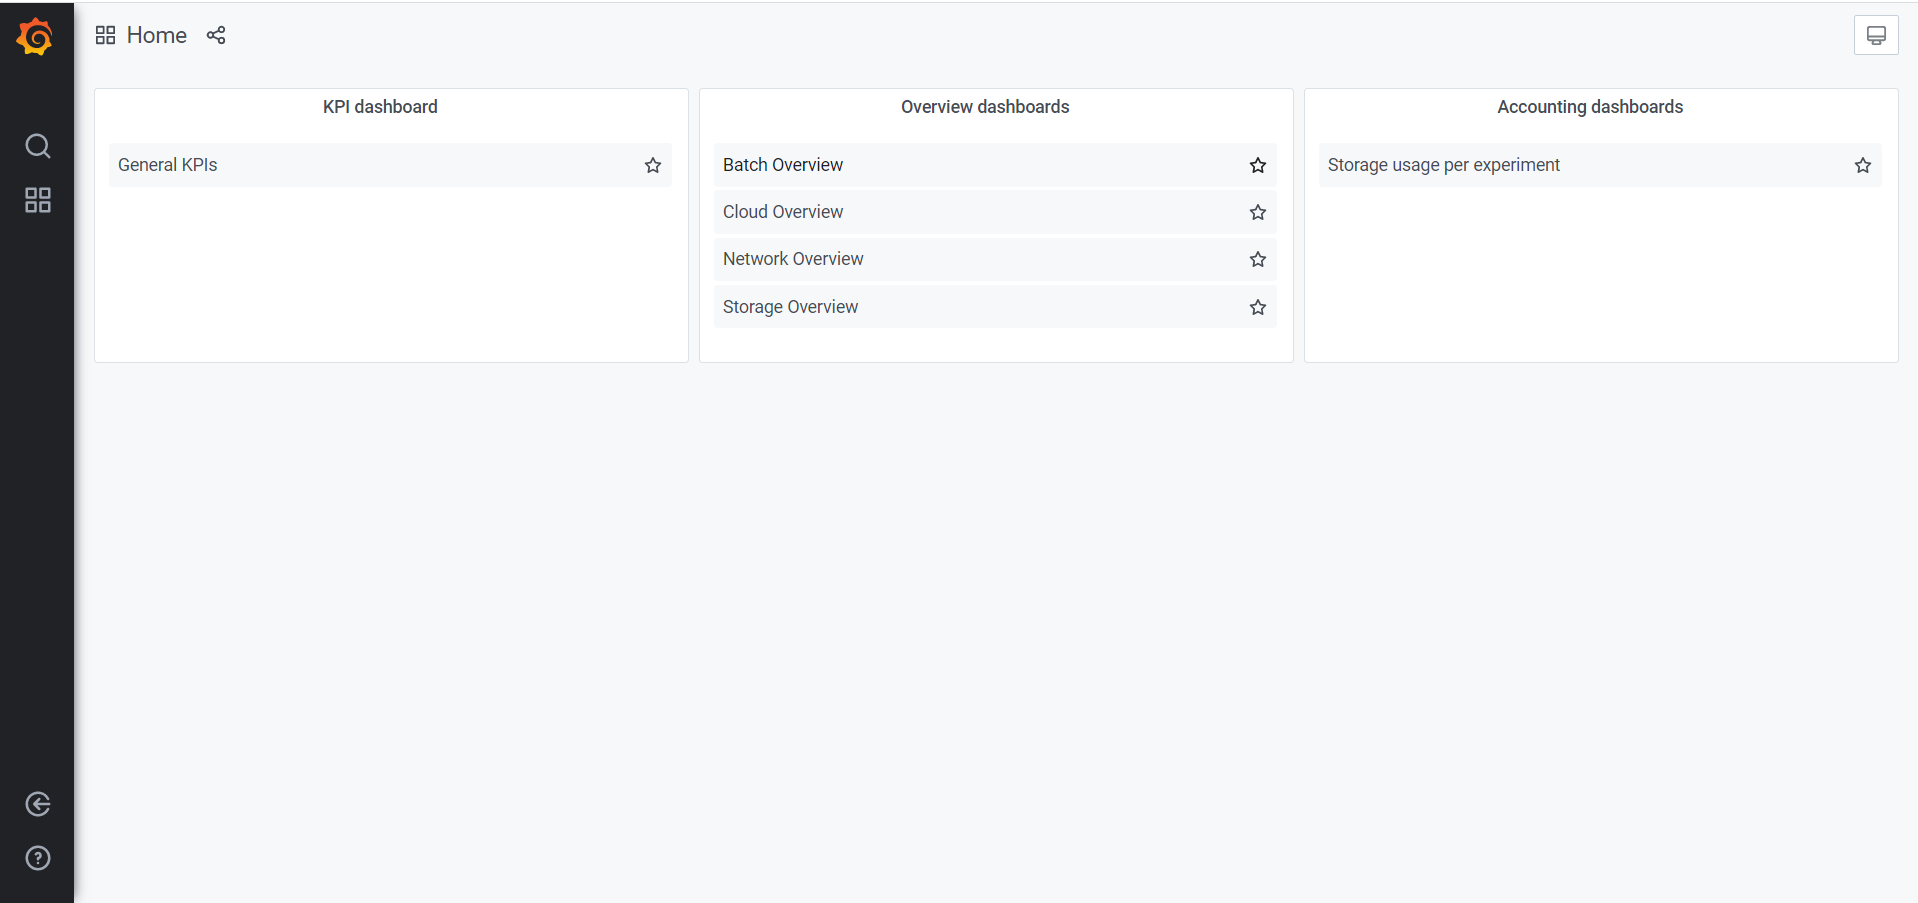
The same actions are feasible from the "Home" button, which opens the following menu:
NB: If some script fails to get data it results in a zero record, which doesn't mean that the resource is unavailable.
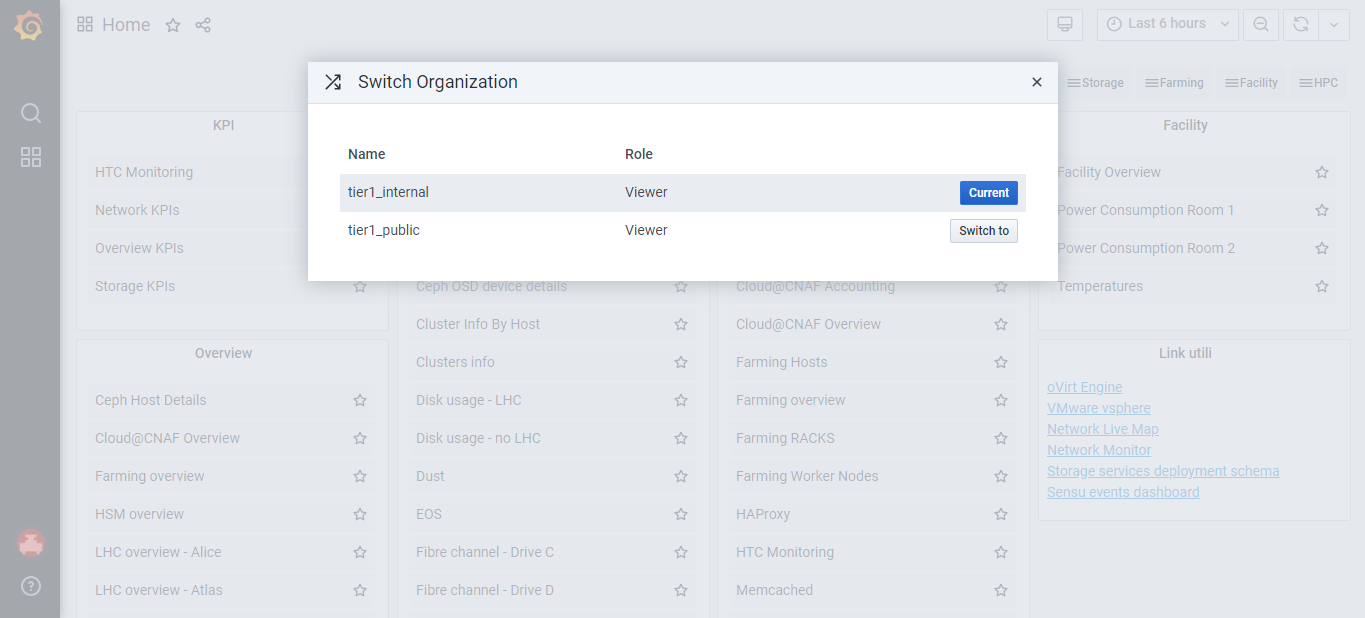
Once you are logged in the Grafana Homepage, from the bottom left button you can switch the view from a "tier1_public" into an "tier1_internal" Organization:
At this point you get the complete view of the Grafana dashboard:
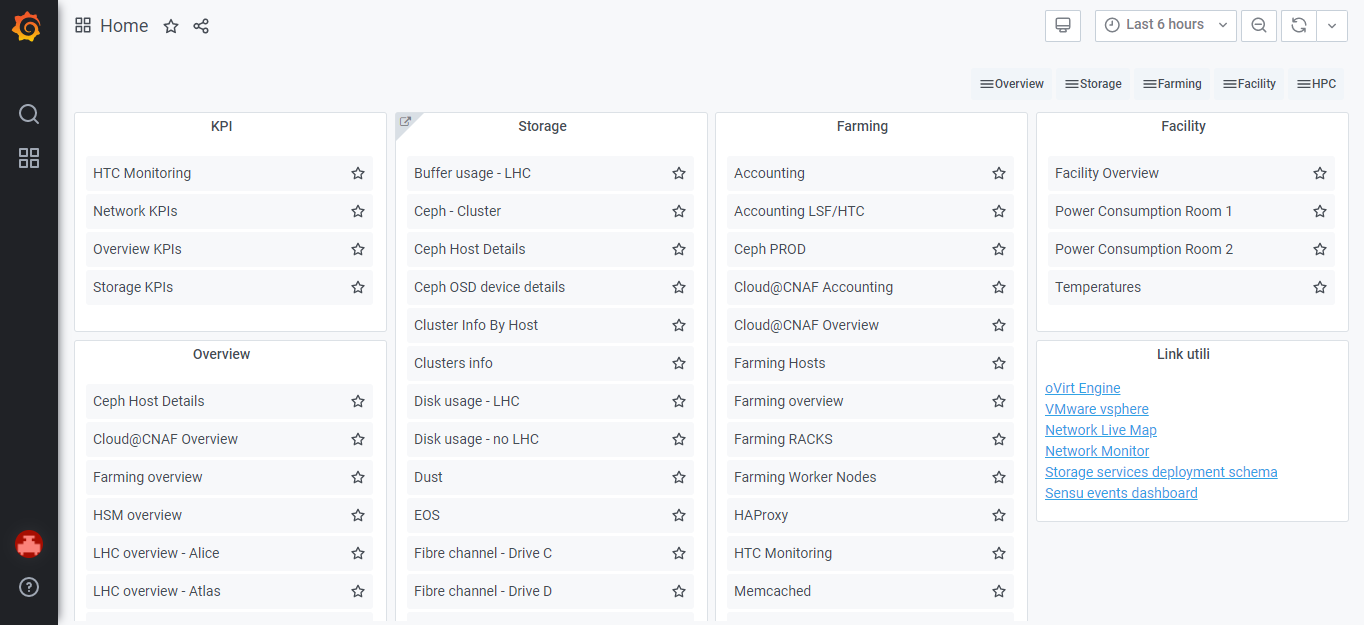
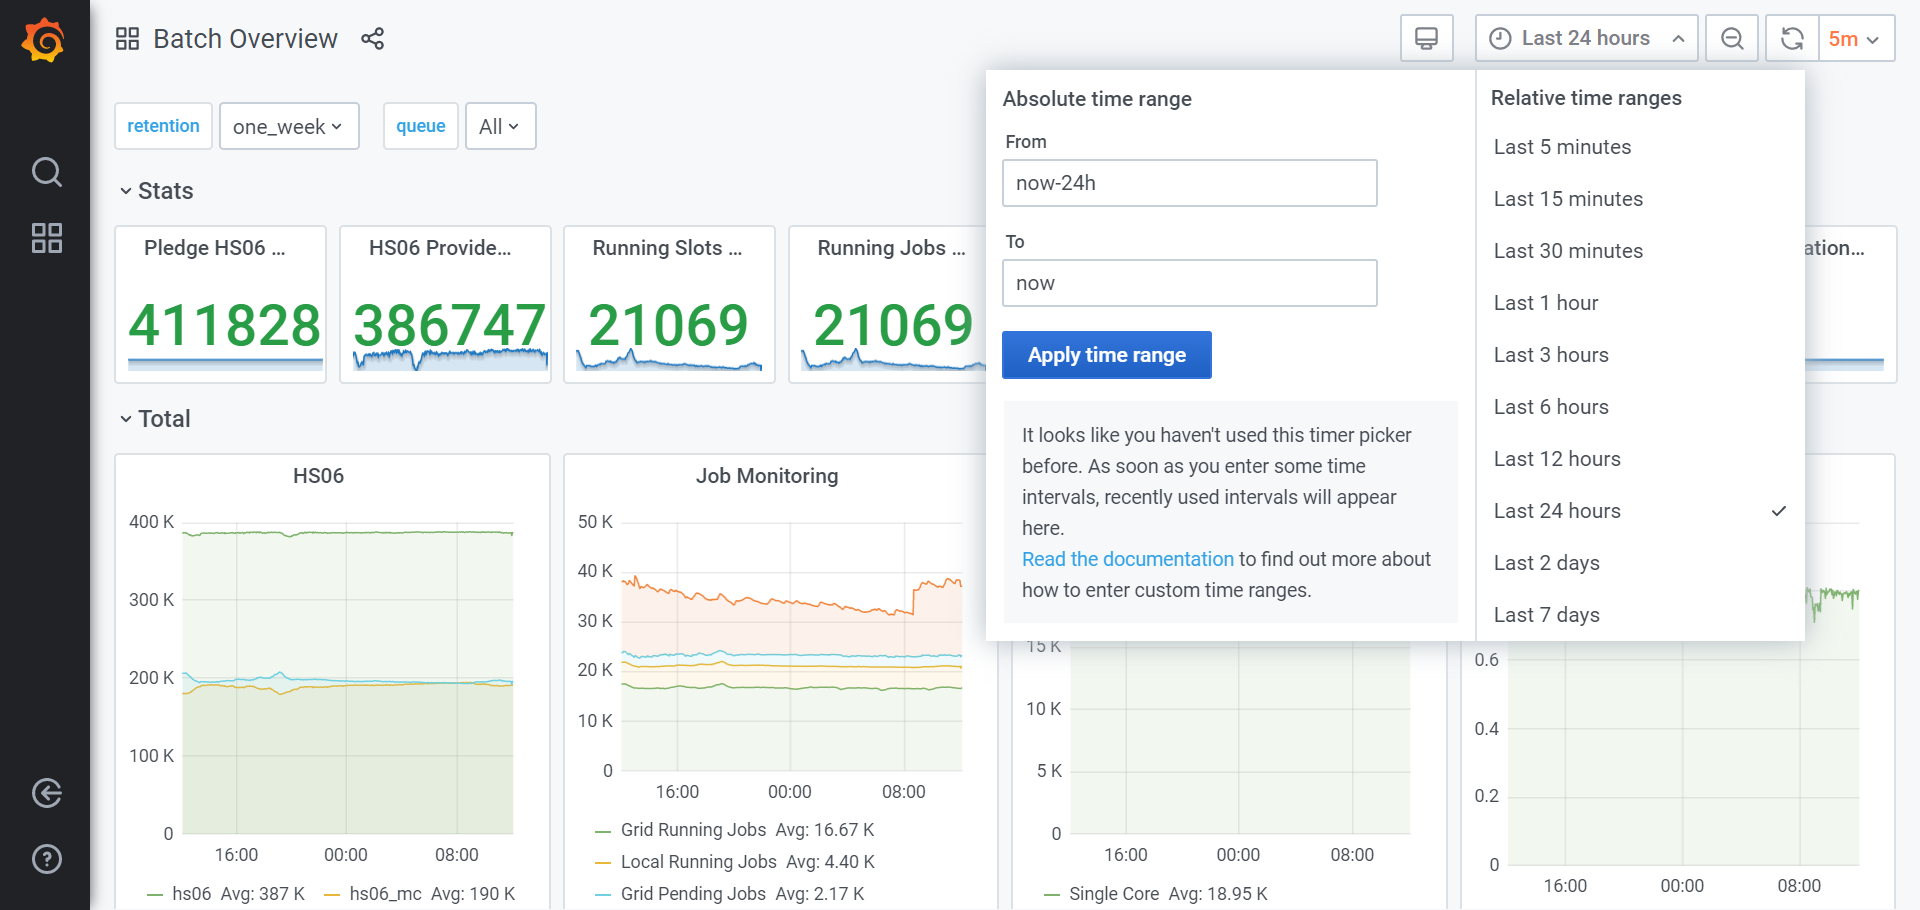
From here you can select the desired service and browse through different options. For instance, in the top right corner you can change the time interval to watch:
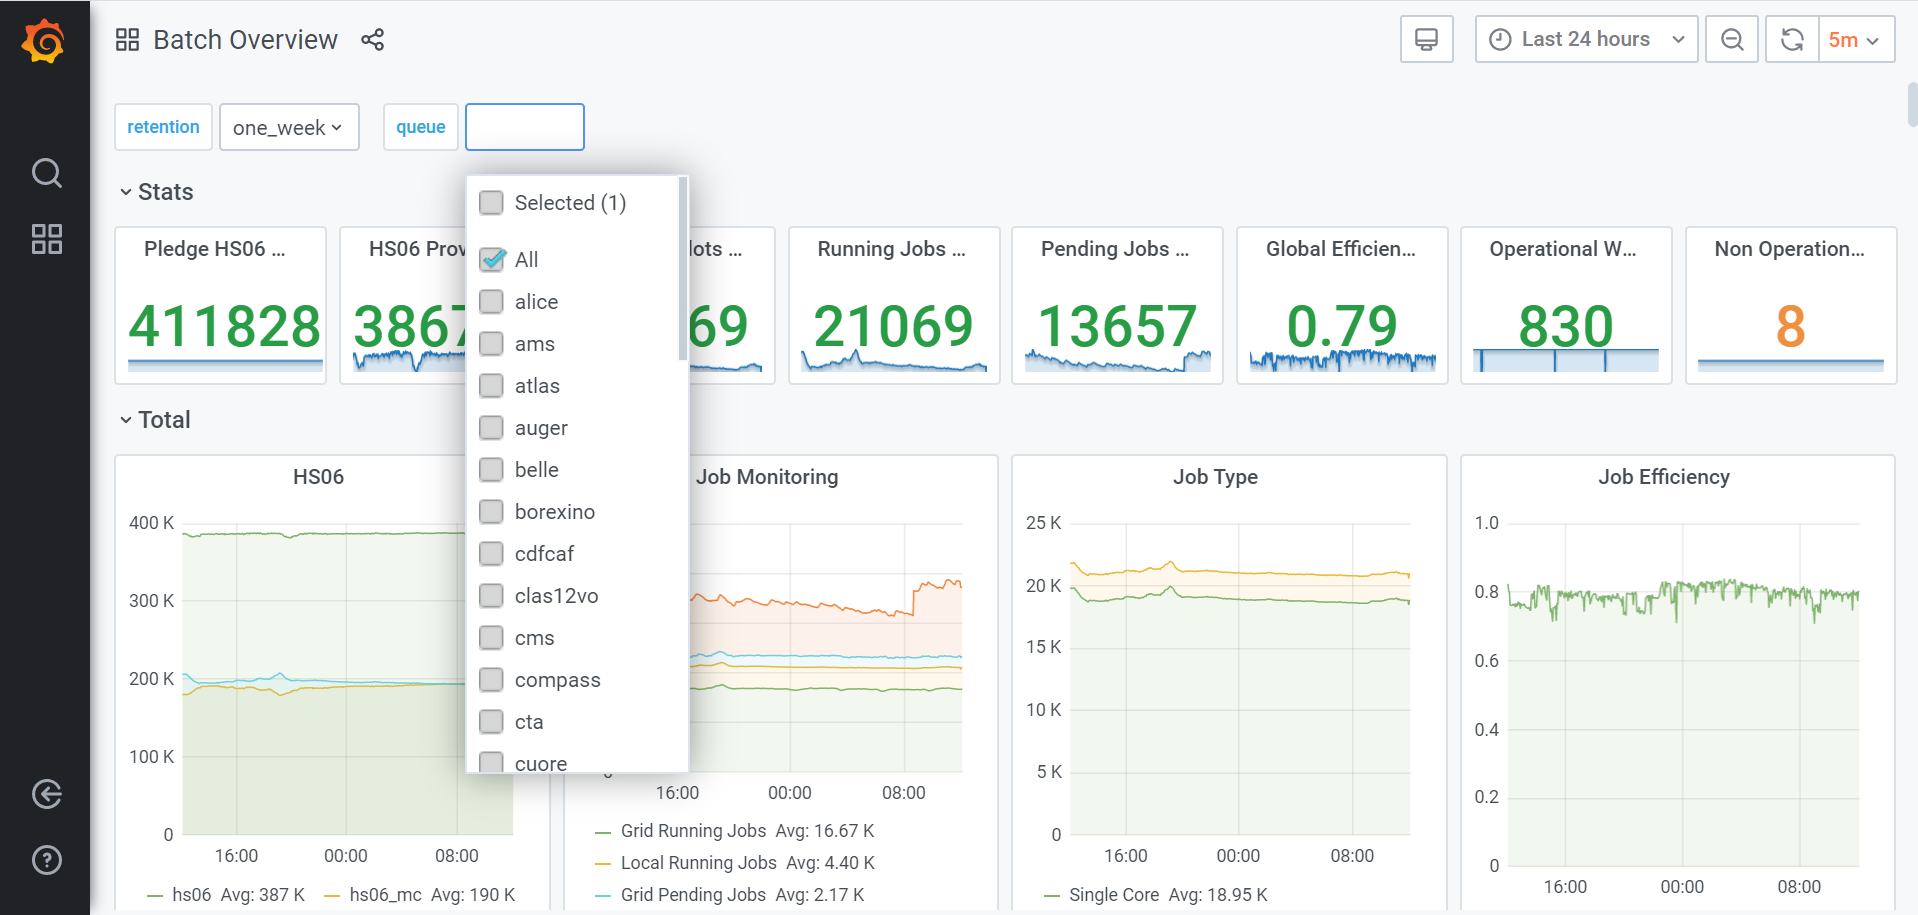
and, selecting one of the "per queue" views, you can choose which ones to show:
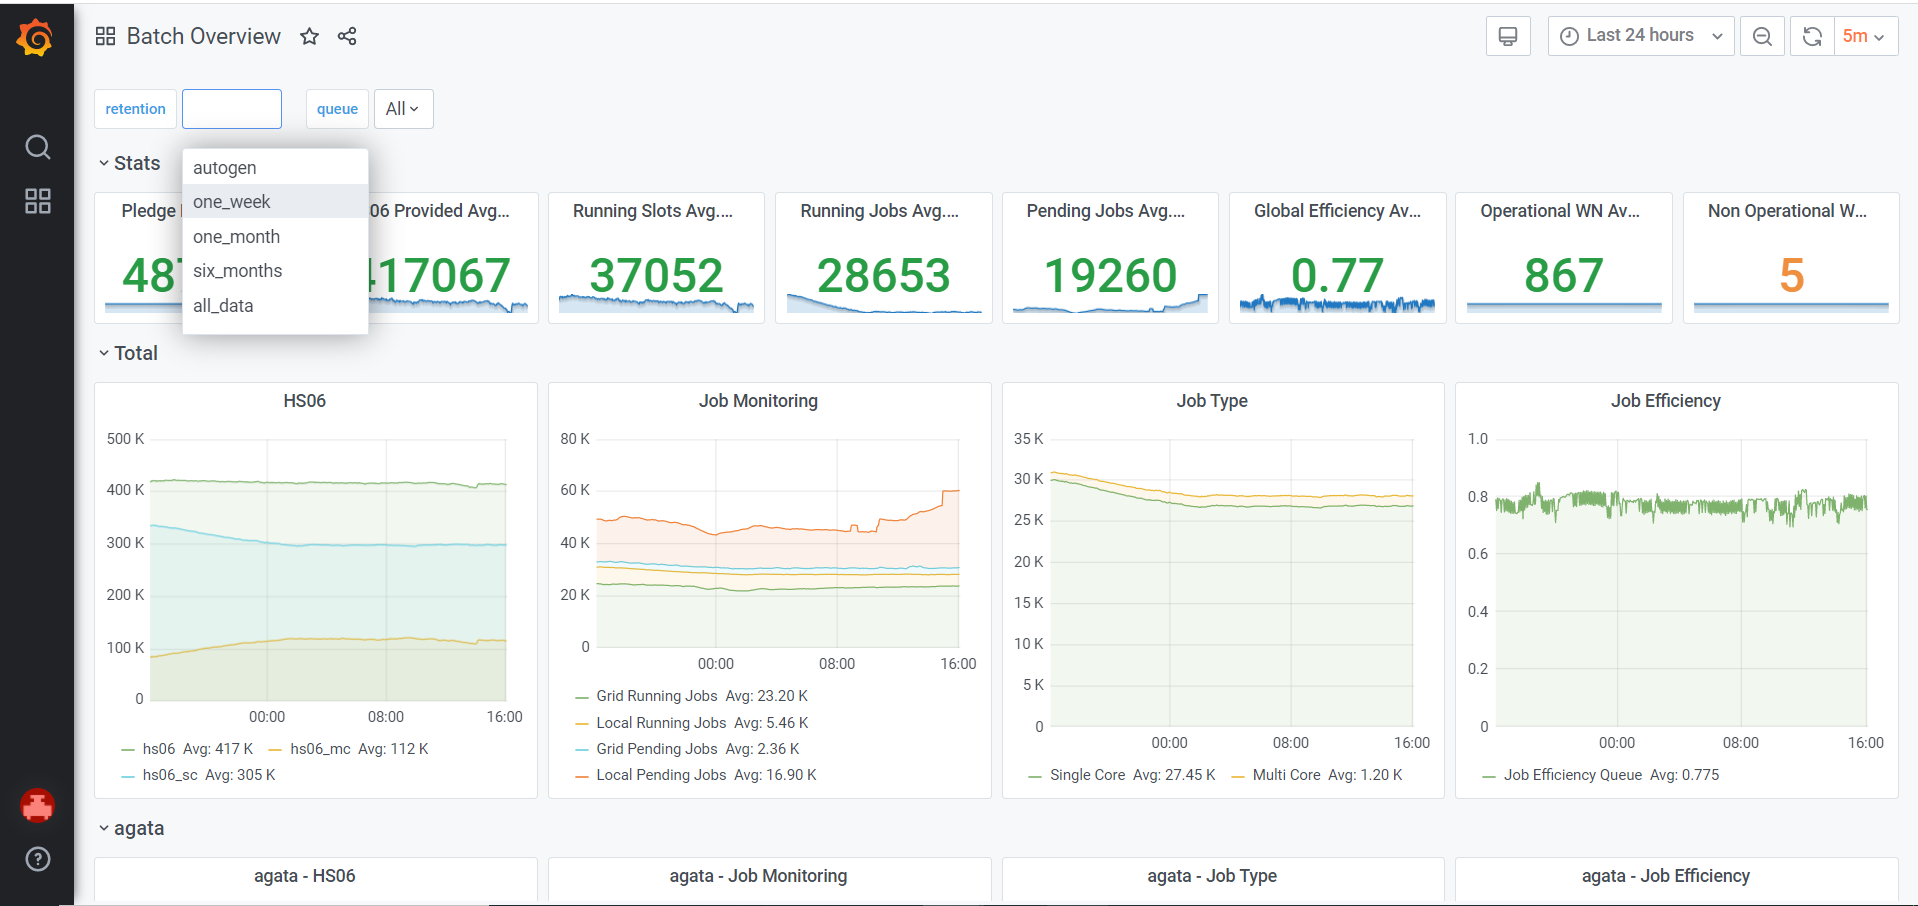
You can also select the desired retention, by clicking on the top left corner:
Moreover, disk situation can be checked here: http://www.cnaf.infn.it/~vladimir/gpfs.