...
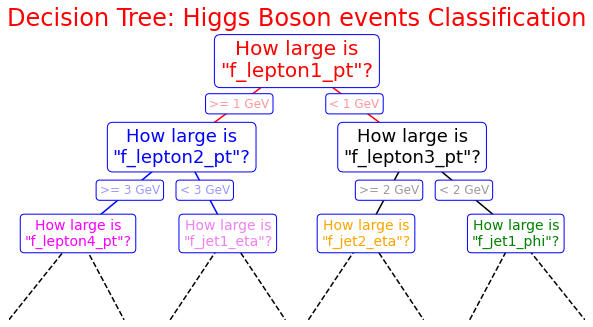
import matplotlib.pyplot as plt
%matplotlib inline
fig = plt.figure(figsize=(10, 4))
ax = fig.add_axes([0, 0, 0.8, 1], frameon=False, xticks=[], yticks=[])
ax.set_title('Decision Tree: Higgs Boson events Classification', size=24,color='red')

def text(ax, x, y, t, size=20, **kwargs):
    ax.text(x, y, t,
            ha='center', va='center', size=size,
            bbox=dict( boxstyle='round', ec='blue', fc='w' ), **kwargs)

# Here you are the variables we can use for the training phase:
# --------------------------------------------------------------------------
# High level features:
# ['f_massjj', 'f_deltajj', 'f_mass4l', 'f_Z1mass' , 'f_Z2mass']
# --------------------------------------------------------------------------
# Low level features:
#        [ 'f_lept1_pt','f_lept1_eta','f_lept1_phi', \
#          'f_lept2_pt','f_lept2_eta','f_lept2_phi', \
#          'f_lept3_pt','f_lept3_eta','f_lept3_phi', \
#          'f_lept4_pt','f_lept4_eta','f_lept4_phi', \
#          'f_jet1_pt','f_jet1_eta','f_jet1_phi', \
#          'f_jet2_pt','f_jet2_eta','f_jet2_phi']
#---------------------------------------------------------------------------
text(ax, 0.5, 0.9, "How large is\n\"f_lepton1_pt\"?", 20,color='red')
text(ax, 0.3, 0.6, "How large is\n\"f_lepton2_pt\"?", 18,color='blue')
text(ax, 0.7, 0.6, "How large is\n\"f_lepton3_pt\"?", 18)
text(ax, 0.12, 0.3, "How large is\n\"f_lepton4_pt\"?", 14,color='magenta')
text(ax, 0.38, 0.3, "How large is\n\"f_jet1_eta\"?", 14,color='violet')
text(ax, 0.62, 0.3, "How large is\n\"f_jet2_eta\"?", 14,color='orange')
text(ax, 0.88, 0.3, "How large is\n\"f_jet1_phi\"?", 14,color='green')

text(ax, 0.4, 0.75, ">= 1 GeV", 12, alpha=0.4,color='red')
text(ax, 0.6, 0.75, "< 1 GeV", 12, alpha=0.4,color='red')

text(ax, 0.21, 0.45, ">= 3 GeV", 12, alpha=0.4,color='blue')
text(ax, 0.34, 0.45, "< 3 GeV", 12, alpha=0.4,color='blue')

text(ax, 0.66, 0.45, ">= 2 GeV", 12, alpha=0.4,color='black')
text(ax, 0.79, 0.45, "< 2 GeV", 12, alpha=0.4,color='black')

ax.plot([0.3, 0.5, 0.7], [0.6, 0.9, 0.6], '-k',color='red')
ax.plot([0.12, 0.3, 0.38], [0.3, 0.6, 0.3], '-k',color='blue')
ax.plot([0.62, 0.7, 0.88], [0.3, 0.6, 0.3], '-k')
ax.plot([0.0, 0.12, 0.20], [0.0, 0.3, 0.0], '--k')
ax.plot([0.28, 0.38, 0.48], [0.0, 0.3, 0.0], '--k')
ax.plot([0.52, 0.62, 0.72], [0.0, 0.3, 0.0], '--k')
ax.plot([0.8, 0.88, 1.0], [0.0, 0.3, 0.0], '--k')
ax.axis([0, 1, 0, 1])

fig.savefig('05.08-decision-tree.png')