...
- If not done already, install rclone following this instructions
- You can now configure the access to one of the supported cloud storage (complete list here)
- e.g. if you want to have local/posix access to your google drive files you should follow this guide
- pay attention to answering no when prompted with "Use auto config?", expecially if you are running on a remote host
- e.g. if you want to have local/posix access to your google drive files you should follow this guide
- You can now mount locally any of the supported cloud storage using rclone mount as shown here
Monitor the resources
A monitoring page will be available for each deployment on the port 3000. The metrics are collected using Prometheus technology and then exposed through Grafana dashboards.
It will show, by default, 3 Grafana dashboards:
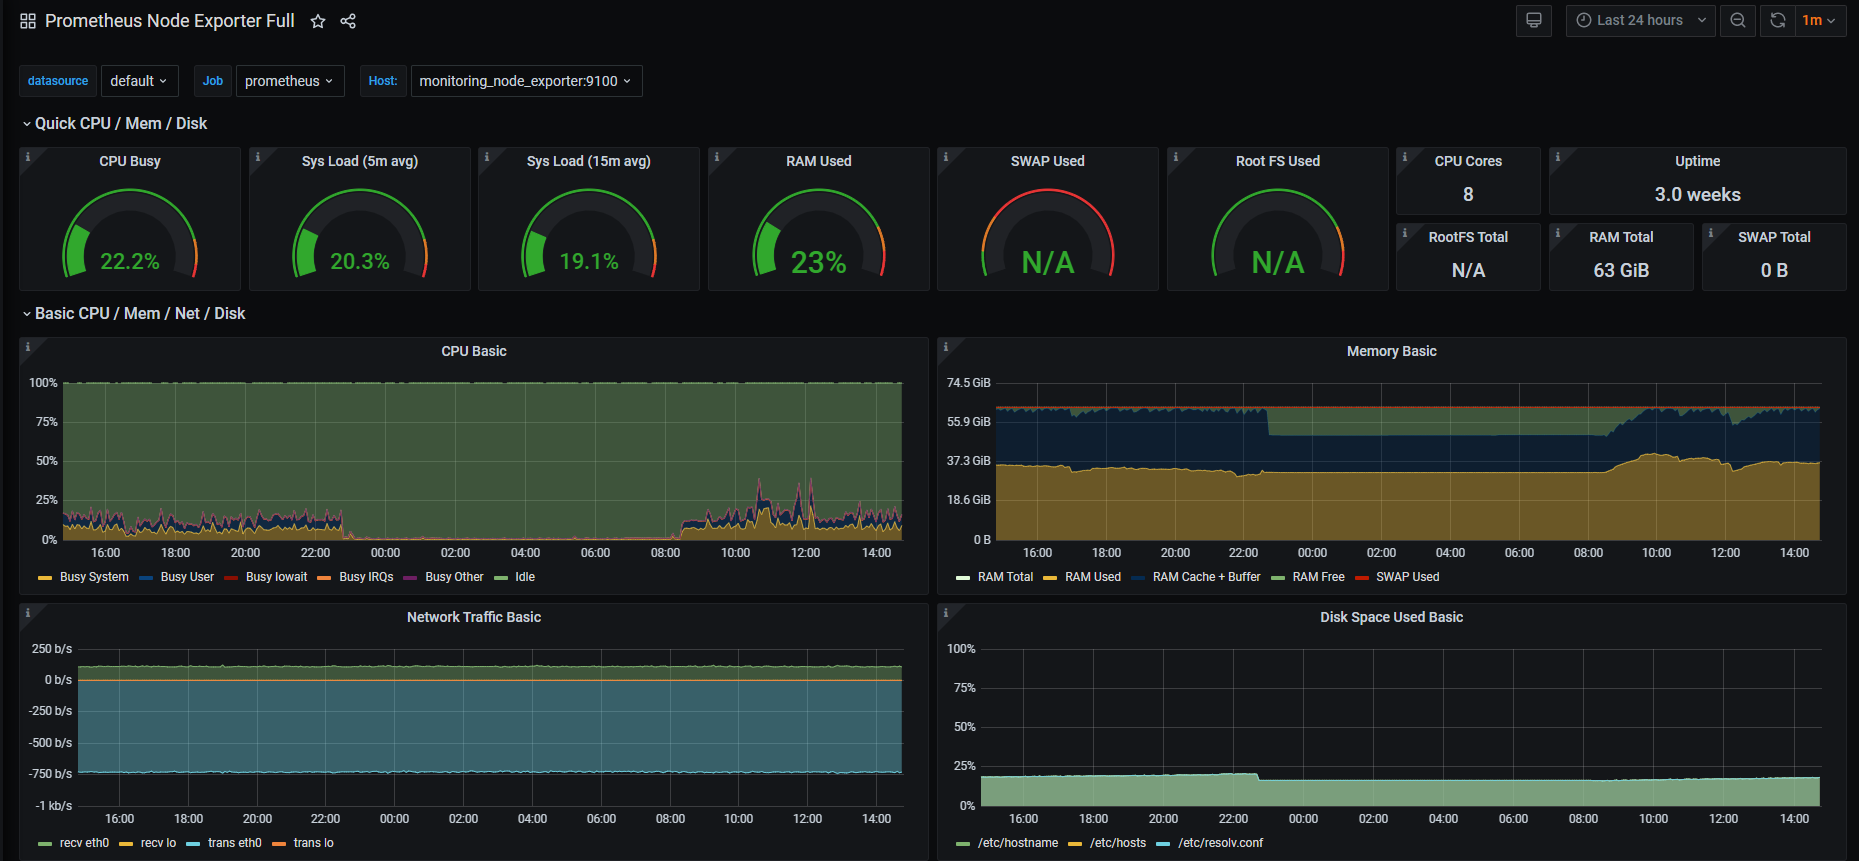
- VM level metrics: CPU, Memory, Network and many other
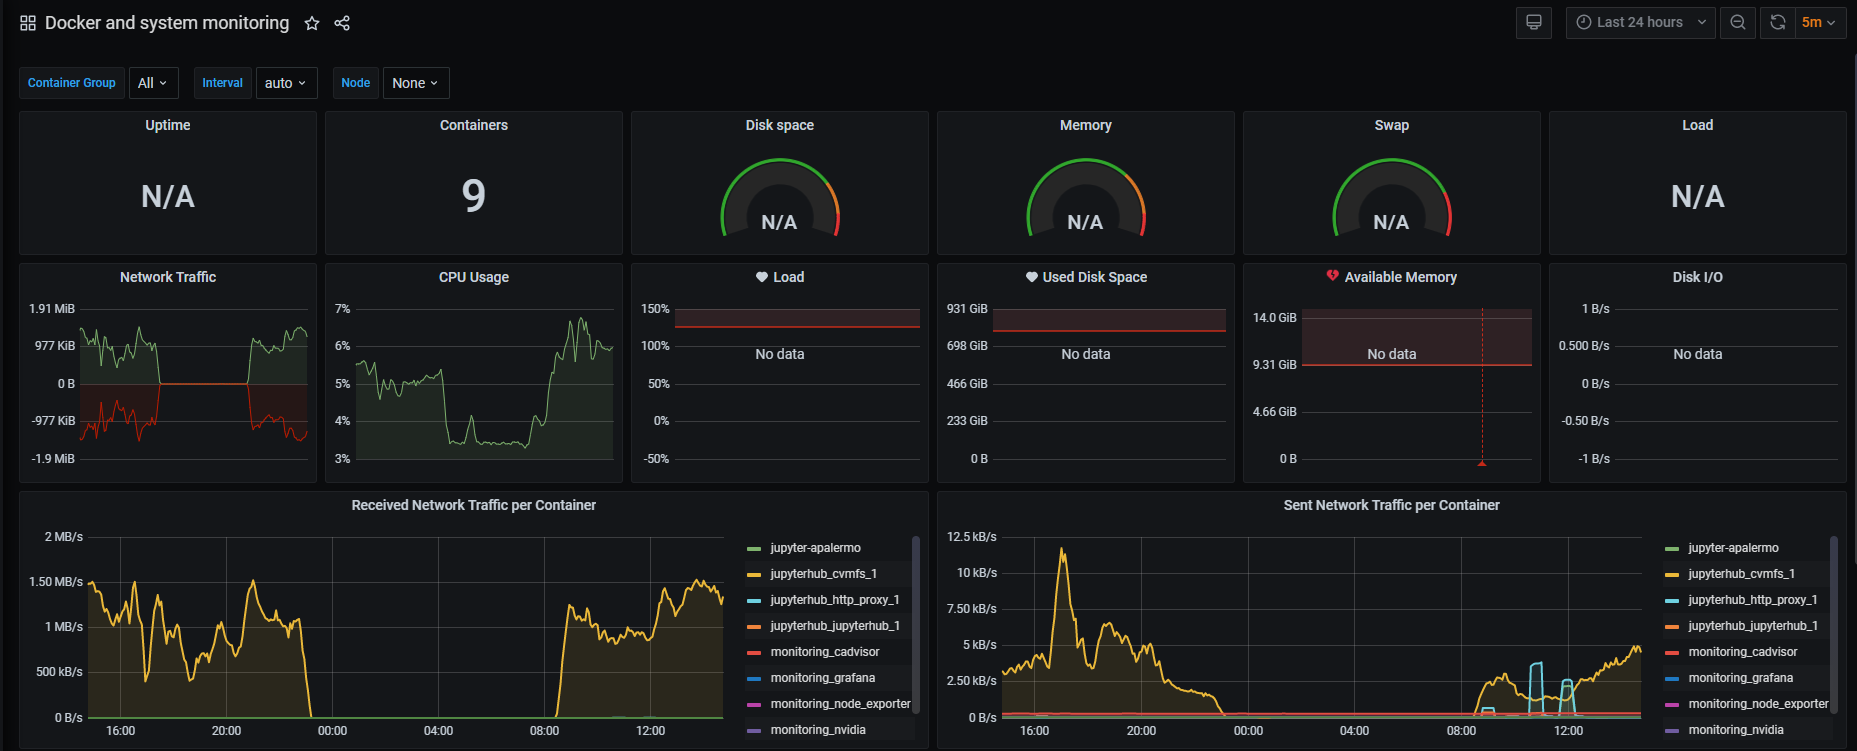
- Docker containers metrics: resource consumption by container mainly
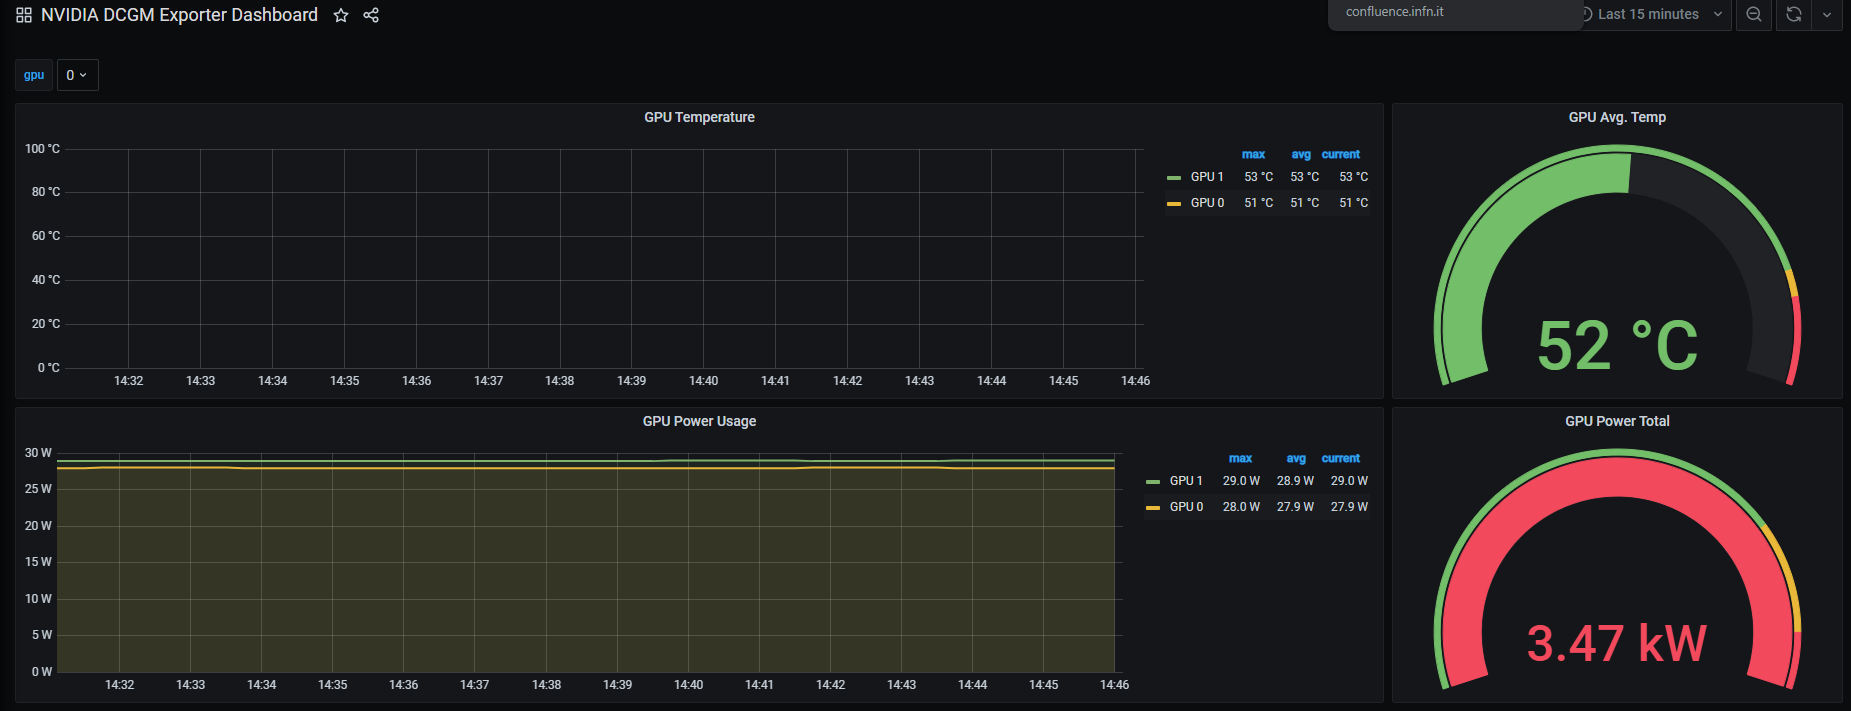
- In a GPU is available, also a dashboard with GPU usage and temperature will be shown