...
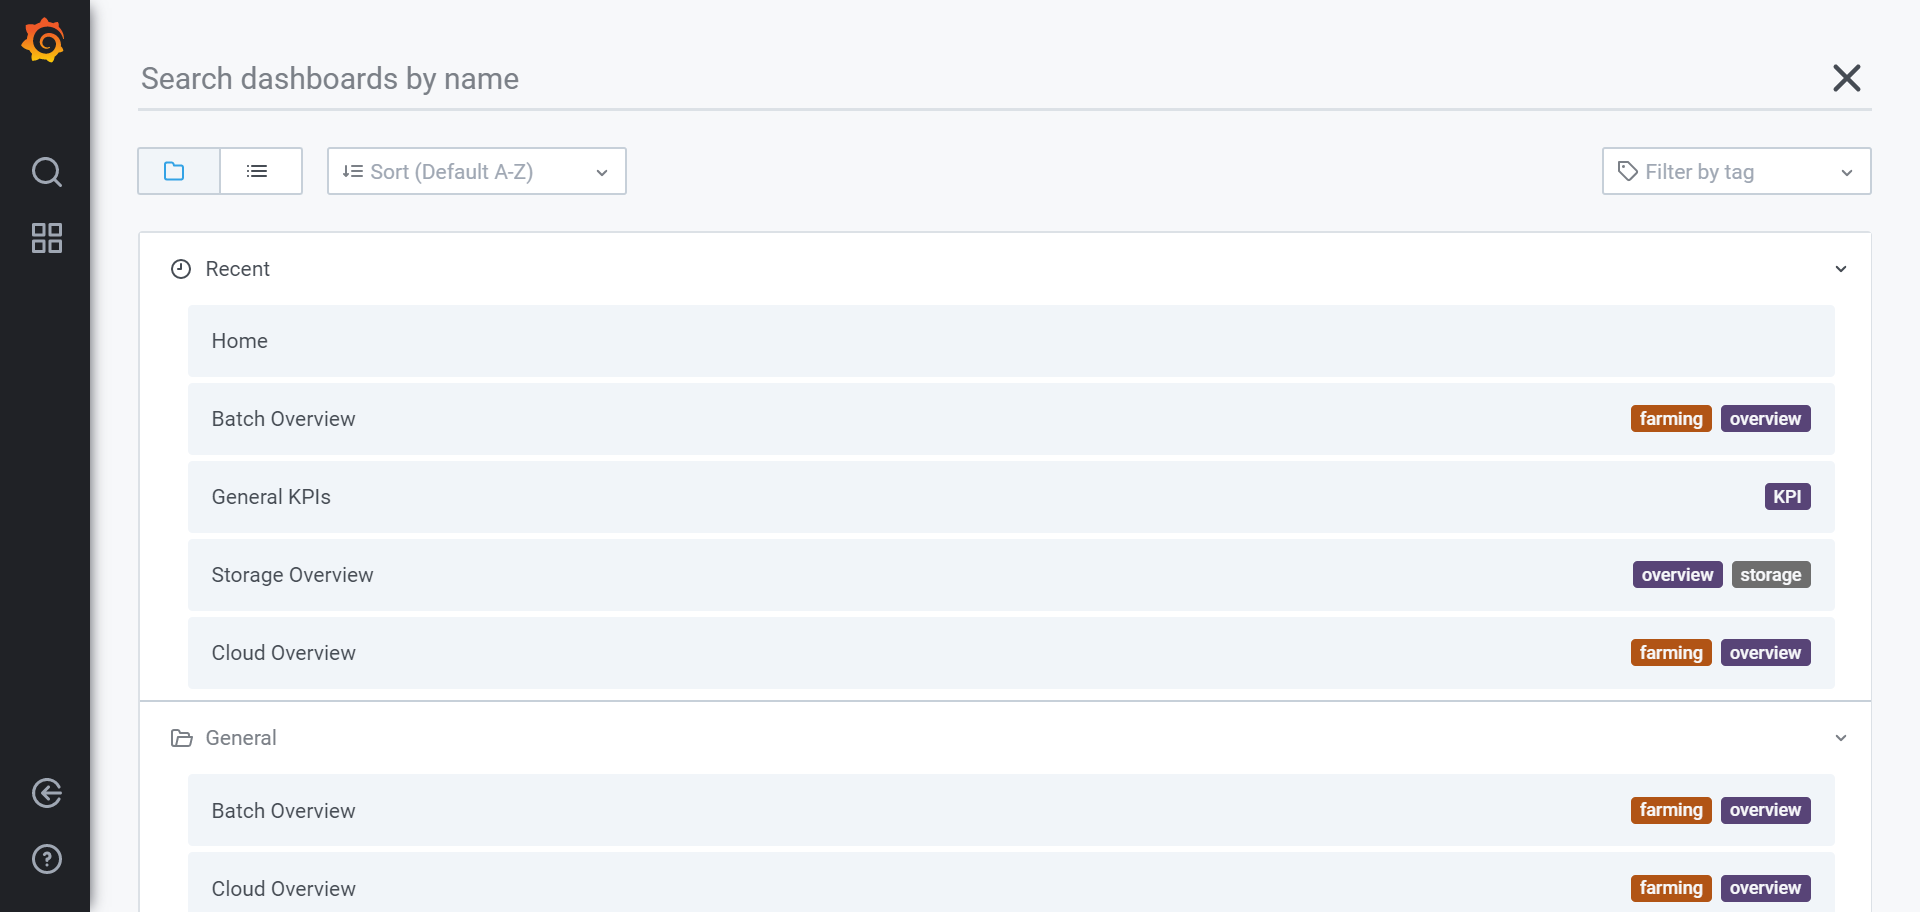
The same actions are feasible from the "Home" button, which opens the following menu:
NB: If some script fails to get data it results in a zero record, which doesn't mean that the resource is unavailable.
...
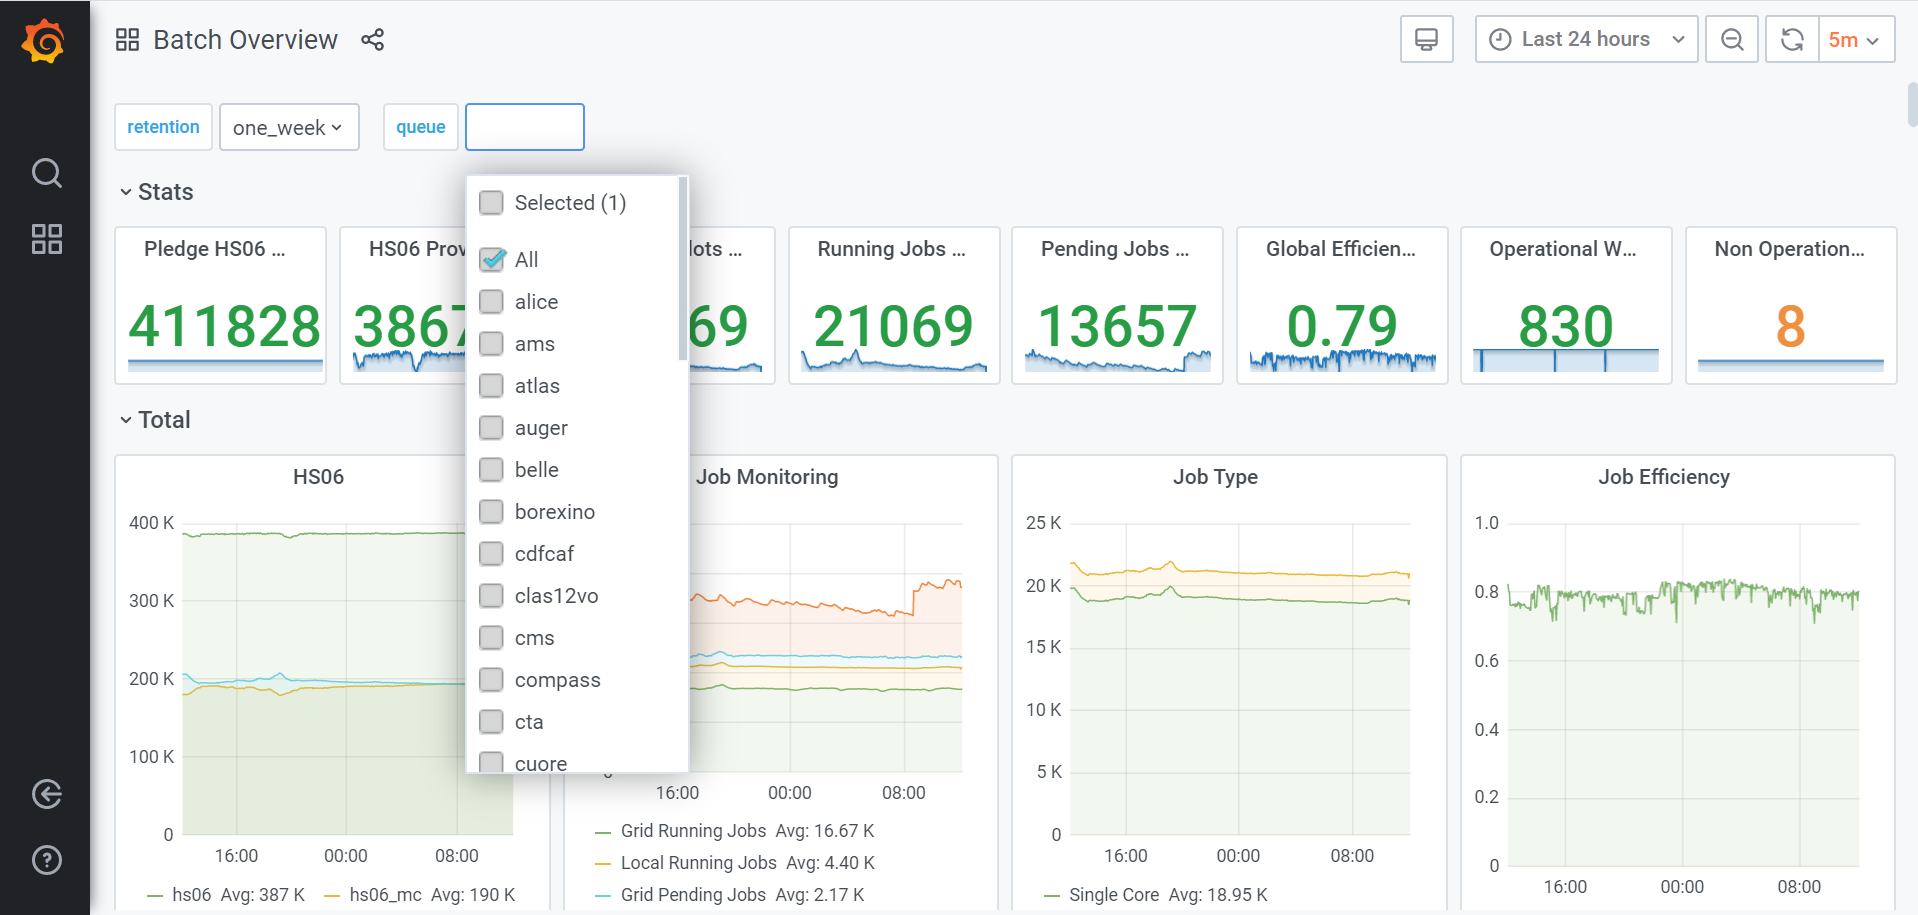
At this point you get the comple complete view of the Grafana dashboard:
...
and, selecting one of the "per queue" views, you can choose which ones to show:
Moreover, disk situation can be checked here: http://www.cnaf.infn.it/~vladimir/gpfs.