...
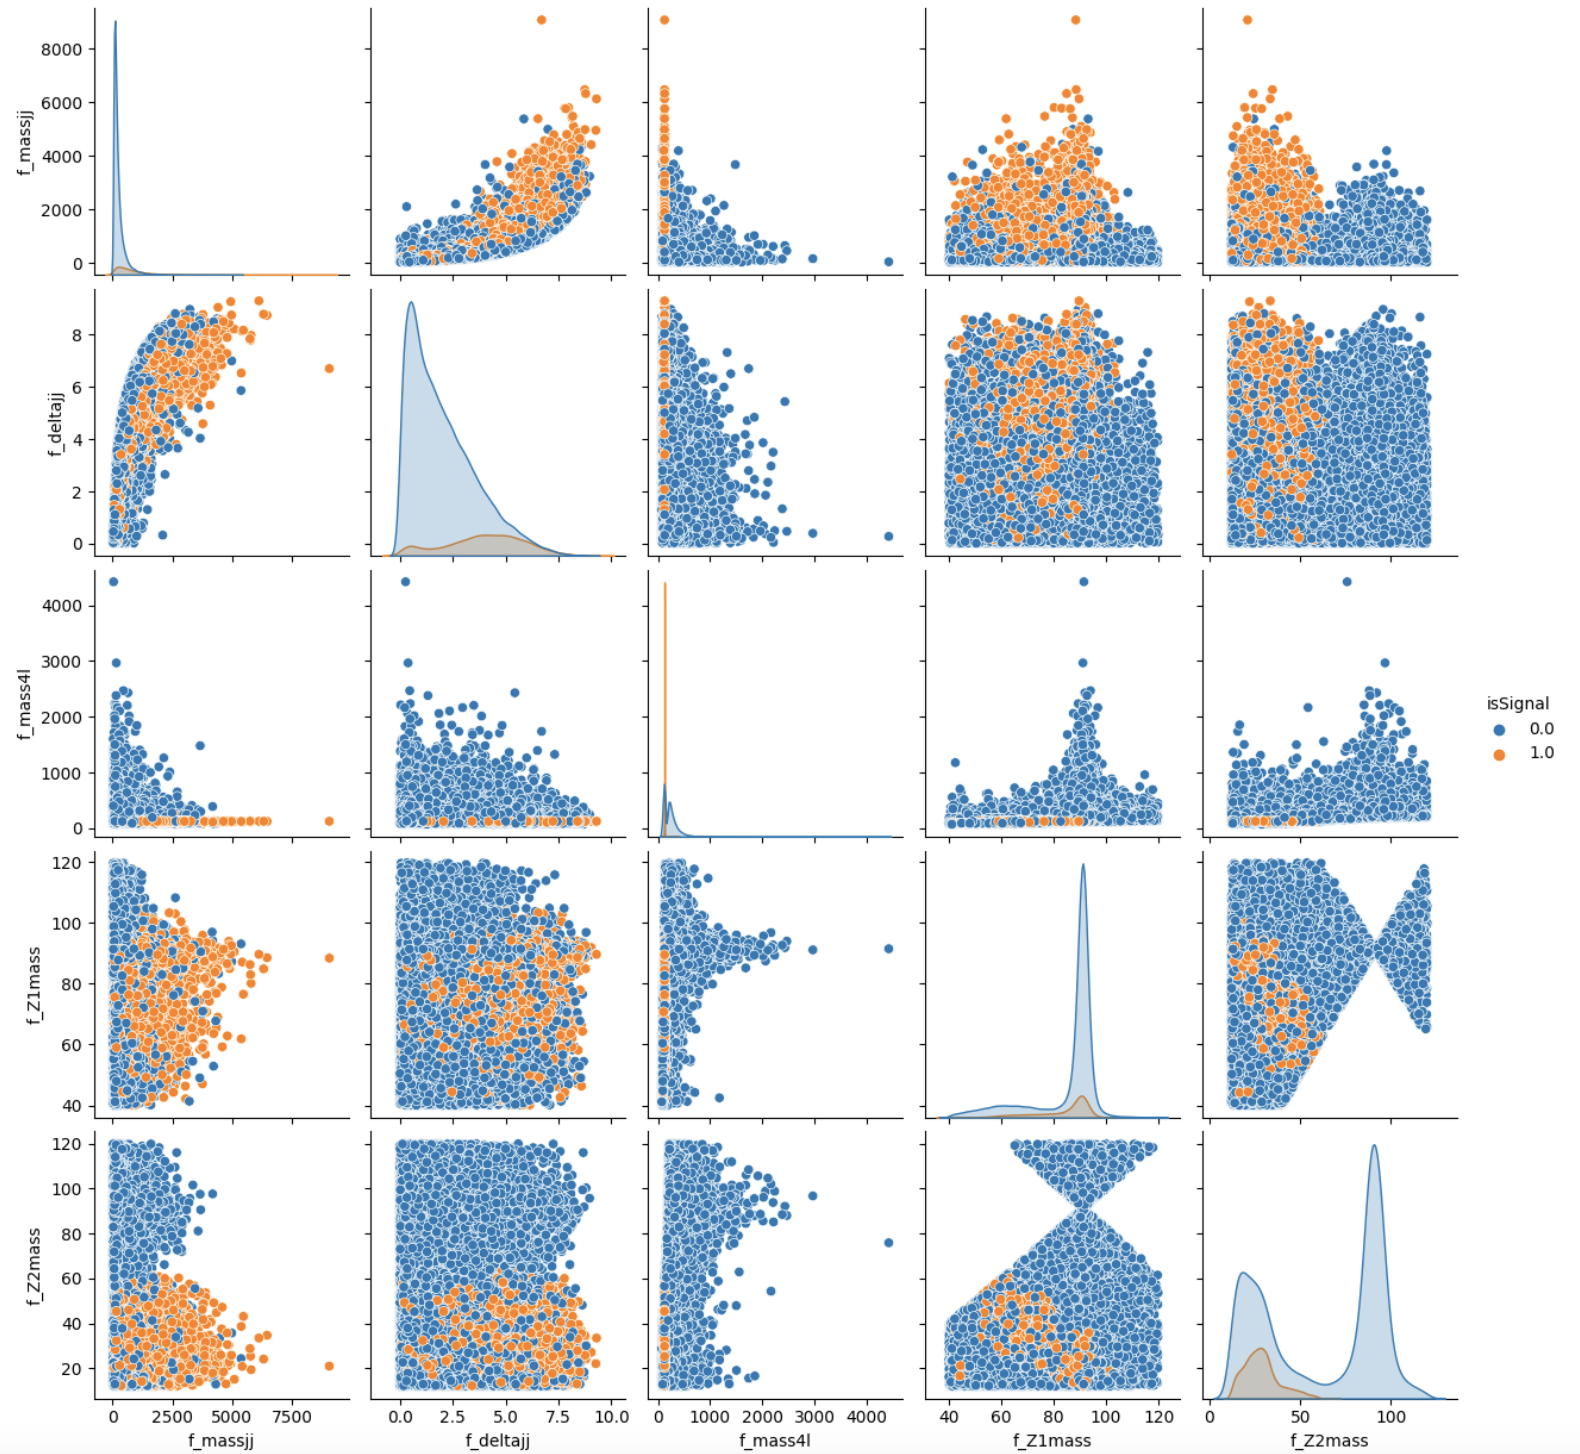
# It will take a while (5 minutes), you can skip it as said before.
# We leave you the output of this code cell using a .png format
# VAR = [ 'f_massjj', 'f_deltajj', 'f_mass4l', 'f_Z1mass' , 'f_Z2mass', 'isSignal']
# sns.pairplot( data=df_all.filter(VAR), hue='isSignal' , kind='scatter', diag_kind='auto' );
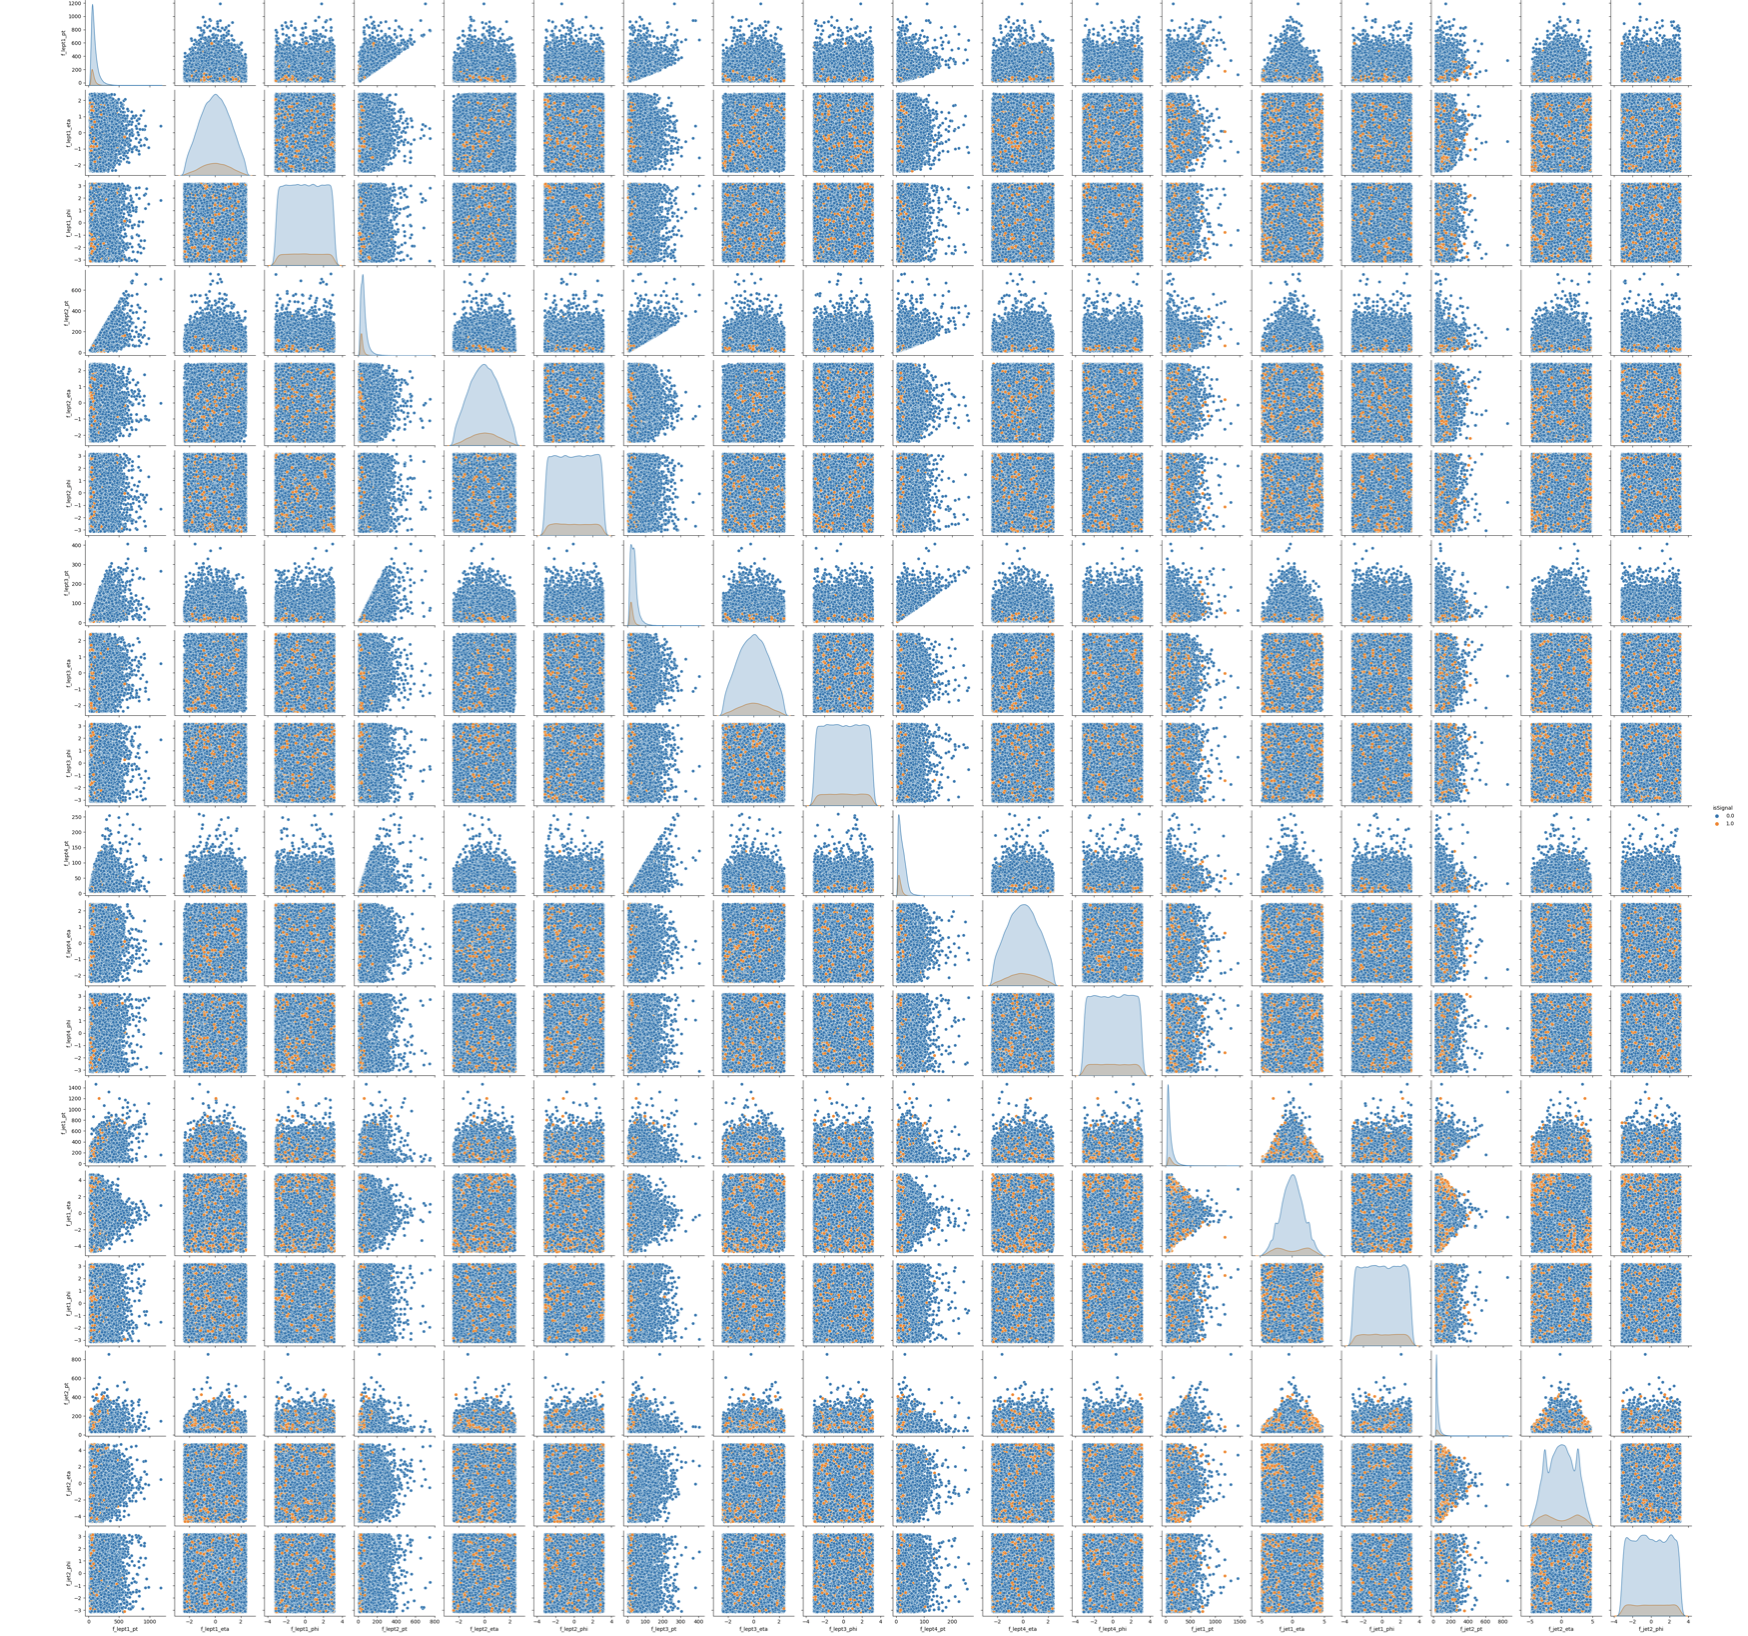
# It will take a while (1 hour). Skip it!
# We leave you the output of this code cell using a .png format

# NN_VARS = ['f_lept1_pt','f_lept1_eta','f_lept1_phi', \
#           'f_lept2_pt','f_lept2_eta','f_lept2_phi', \
#           'f_lept3_pt','f_lept3_eta','f_lept3_phi', \
#           'f_lept4_pt','f_lept4_eta','f_lept4_phi', \
#           'f_jet1_pt','f_jet1_eta','f_jet1_phi', \
#           'f_jet2_pt','f_jet2_eta','f_jet2_phi', 'isSignal']
# sns.pairplot( data=df_all.filter(NN_VARS), hue='isSignal' , kind='scatter', diag_kind='auto' );